Updated and Effective Date: May 28, 2026
We know platform changes can raise questions, especially when they impact reporting. This update is designed to simplify your experience, not complicate it.
Since 2025, we’ve been introducing new dashboards that provide a clearer, more modern analytics experience with improved accuracy and more meaningful insights. These dashboards are built to be easier to navigate and designed to support how customers use reporting today.
As part of this evolution, legacy dashboards were permanently deprecated on April 7. Of course, no historical data was lost. If you need access to historical reporting, our support team can provide it upon request.
This page outlines everything you need to know about the transition, including:
Feature Access must be manually enabled to view the new Analytics dashboards in Console:
1. Go to Feature Access
2. Filter Feature Family to Analytics
3. Turn on the dashboards you’d like to see. We’ll go into further detail below on what each dashboard will cover.
Be sure to expand each Analytics section in Feature Access and toggle on all relevant dashboards.
One additional capability worth highlighting across the new analytics experience is the ability to customize reporting tables based on the data most important to each organization. Across many of the dashboards and reports, administrators now have the ability to customize which columns appear within reporting tables.
Using the Customize option, you can now choose which columns you want to display, reorder the columns, and tailor your table layout to better match your reporting needs.
Our new analytics experience combines familiar reporting with new insights to create a faster, more cohesive, and easier-to-understand dashboard experience.
Read on for a breakdown of each report, or watch the full demo video here.
New Reporting in Console
Users
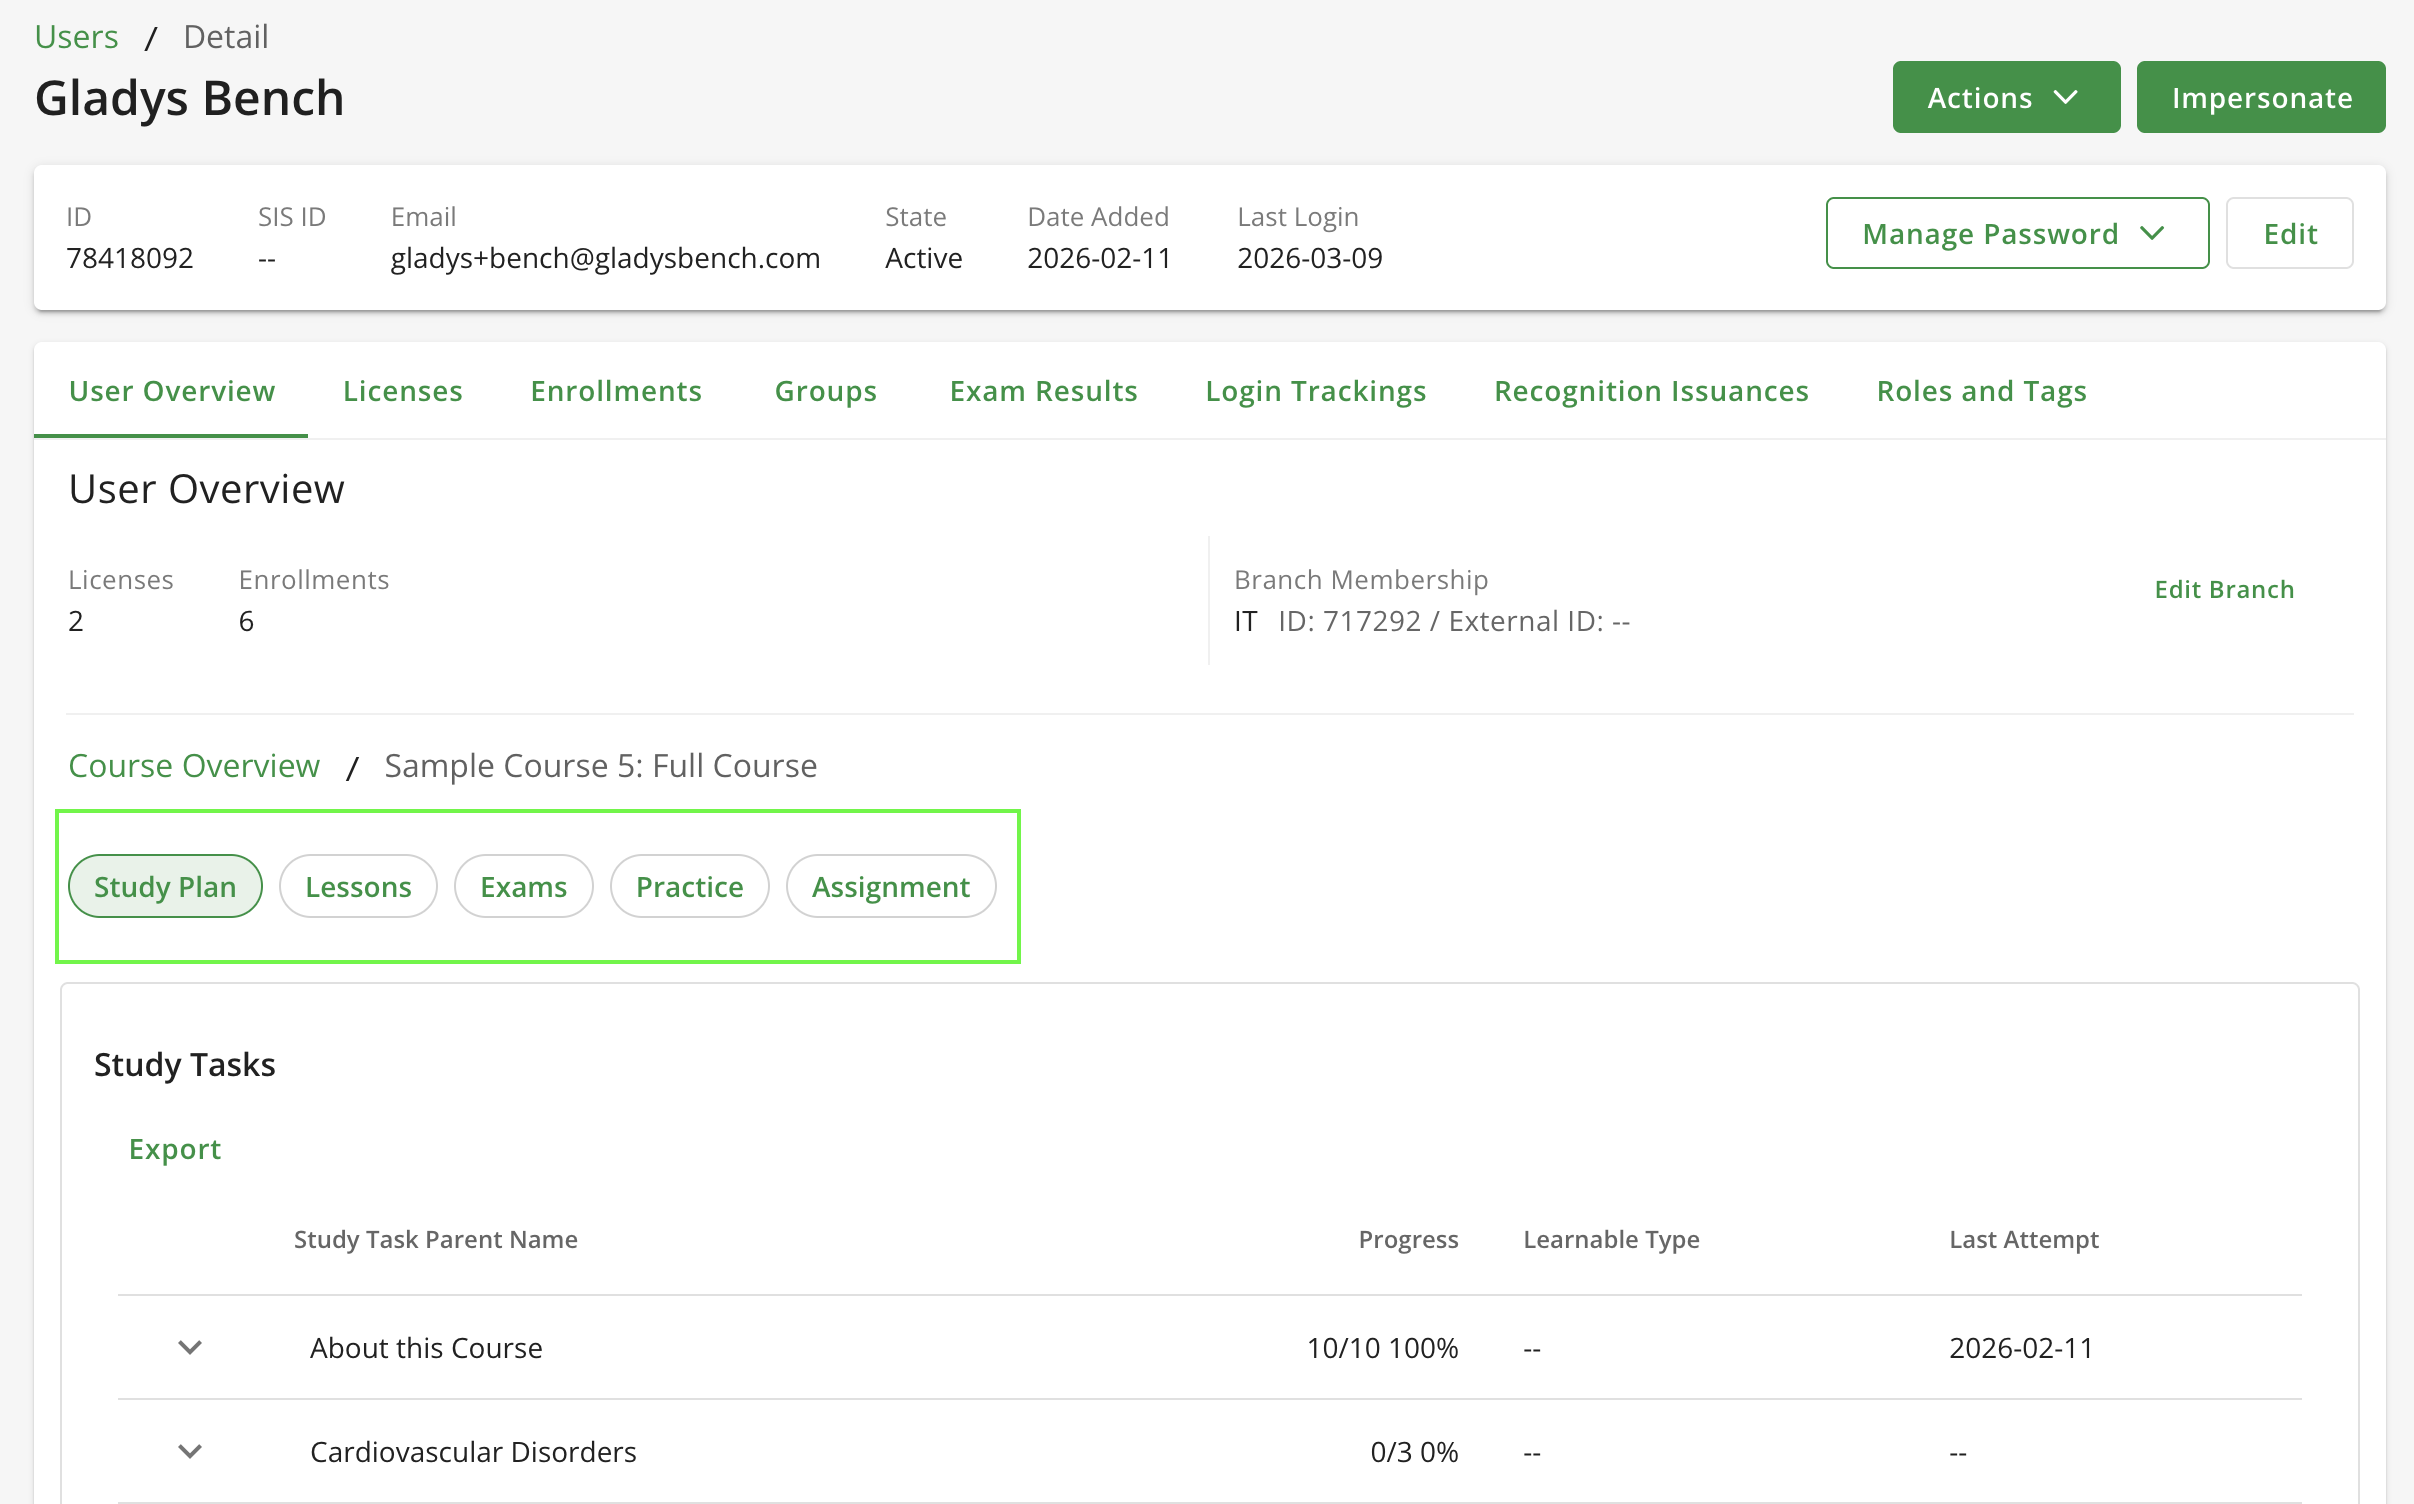
Viewing a user profile now provides:
Branches (Only available for Enterprise Engine customers)
Clicking into a Branch now shows:
Groups (Only available for Enterprise Engine customers)
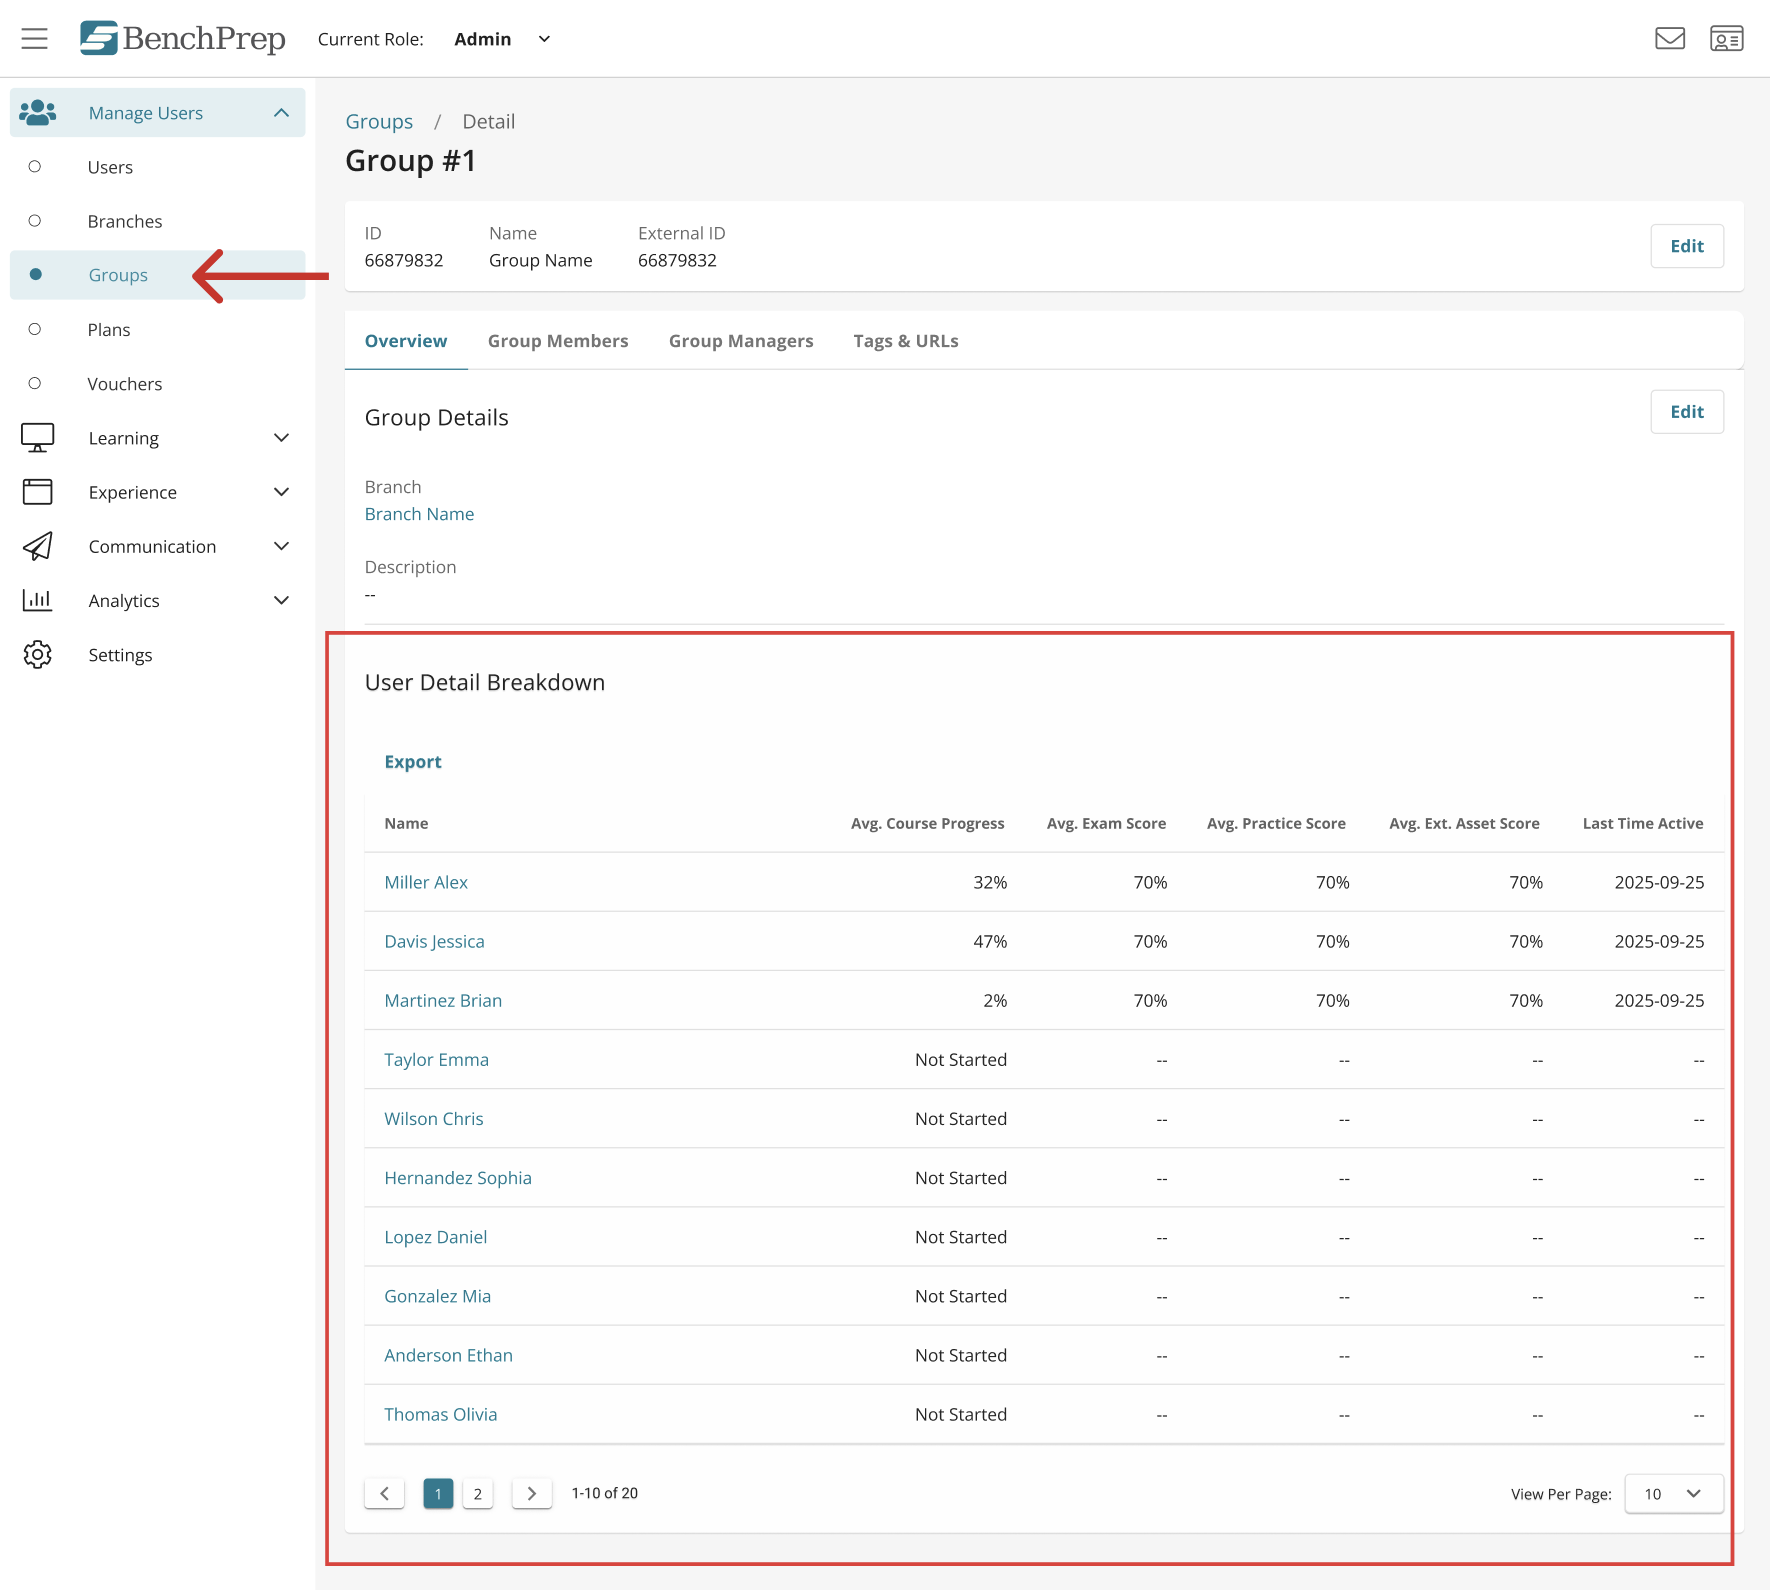
Clicking into a Group now shows:
Course Reports

This dashboard provides a comprehensive view of course activity and performance. Drilling into a specific course shows:
Session Details Report
.png)
Track learner activity at the session level, including
AI Usage Report

For tenants with AI Assistant enabled in courses, a new AI Usage report is now available in BenchPrep Analytics, giving visibility into how learners are interacting with the AI Assistant.
Read our Knowledge Base article for more detail on our reports.
To reduce reporting inconsistencies and simplify navigation, the following legacy dashboards are being retired:

Please note that Standard Reports will remain. Historical data from these dashboards will continue to be retained and is available upon support request through our team. Most reporting capabilities have already been migrated to the updated analytics dashboards introduced since 2025. However, a small number of reports are still in development and will be released in the coming months.
These upcoming dashboards include:
In the meantime, the table below shows which legacy dashboards are being deprecated and where their reporting capabilities can now be found within the platform.
All analytics reports are available through Feature Access, but the reports you enable should align with how your organization delivers learning.
Below are our recommended configurations based on common business models. Expand each feature in Feature Access to review and enable the individual reports available within each category.
If you are unsure which model applies to your organization, B2B configurations typically support cohort or enterprise client structures, while B2C configurations support direct-to-learner programs.
For B2C Organizations
If your organization delivers learning directly to individual learners, we recommend enabling the following reports:
You may also see Branch Details and Group Detail in Feature Access; however, these reports are designed for enterprise account structures and are typically not applicable to B2C tenants.
For B2B Organizations
If your organization delivers learning through enterprise clients, cohorts, or group-based programs, we recommend enabling the following reports. Tenants with Enterprise Engine should enable:
These reports provide the additional segmentation needed to analyze learner activity across organizations, branches, and groups.
Access permissions for the new analytics dashboards follow the same rules used for the legacy dashboards.If your organization uses custom roles, viewing permissions are determined by the analytics permissions previously assigned to those roles.
The Read: Reports permission controls access to analytics dashboards and allows a user to view the User Dashboard, Branch Dashboard, Group Dashboard, and Course Reports (if enabled) within the Analytics section in Console.
Default BenchPrep Roles and Dashboard Access
If you are using default BenchPrep roles, dashboard visibility follows the structure below.
Note: Role titles may appear differently in your tenant.
Additional report-level session permissions will be introduced in a future update.
Legacy dashboards were permanently deprecated on April 7. The updated analytics dashboards introduced since 2025 will continue to provide the most accurate and scalable reporting experience moving forward.
We recommend reviewing the configuration guidance above and confirming that the appropriate reports are enabled for your organization’s business model.
If you have questions about enabling dashboards, configuring Feature Access, or accessing historical data, our team is here to help. Reach out to your dedicated CSM or fill out this Google form here to provide us with more information.

